From complexity to clear insights

Your data should work for you.
Not the other way around

From web development in the UK to data analysis in the Belgian healthcare and social sector, I build Power BI solutions that are robust enough to scale and clear enough for everyone to use. I approach every data challenge from three angles: technical, organisational, and human.
The result? Analytical frameworks that grow with your organisation and that your team will actually want to work with.

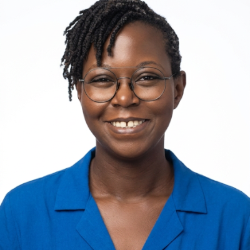
Photo Dr. Joycelyn Harris

My story

HellošŸ‘‹šŸ¾
I’m Dr Joycelyn Harris — and for twenty years, I’ve helped organisations not just collect their data, but truly understand and make use of it.

My career began in the United Kingdom, where I worked as a web and systems developer after completing my undergraduate degree. I moved to Belgium nearly 15 years ago, and I’ve built on that technical foundation as a data professional across a wide range of sectors, including healthcare, social care, HR, and non-profit organisations. That breadth of experience shapes the way I approach every data challenge:
Technical: designing the right architecture for the job.
Organisational: aligning with business objectives and the people who matter.
Human: ensuring that whoever uses the data can actually understand and act on it.

Career Timeline

My passion lies in building Power BI solutions, analytical frameworks, and accompanying documentation that are robust enough to scale — and clear enough for everyone who works with them to actually use. That practical focus is grounded in a strong academic foundation:
Doctorate: PhD in Computer Science from the University of Reading
Master: MSc Applied Informatics from Henley Business School

Because the world of data never stands still, I make a point of continuously expanding my expertise. Recent certifications include Azure Fundamentals, Python, and Advanced Power BI Data Transformation, among others. I am also fluent in Dutch.

Microsoft:
Power Platform Fundamentals
Azure Data Fundamentals
DataCamp:
Deploying & Maintaining Assets in Power BI
Data Transformation in Power BI
SQL for Data Science, UC Davis
Crash Course on Python, Google
Data Science Math Skills, Duke University
SPSS Statistics Essential, LinkedIn Learning
AI for Everyone, DeepLearning.AI
Dutch proficiency levels 1 to 4

Strategic ideas & successful execution

Professional Experience

For more than twenty years, I have helped organisations understand and make use of their information — first as a web and systems developer in the United Kingdom, and subsequently as a data professional in the commercial, healthcare, social, HR, and non-profit sectors in both Belgium and the Netherlands. My most recent roles are listed below, and a full overview of my professional activities is available on my LinkedIn profile.

I am currently open to new part-time contracts or freelance assignments (up to 20 hours per week) on a remote or hybrid basis. If you are looking for a reliable Power BI expert to build scalable analytical frameworks for your team, please fill out the contact form below to share your project details.

Data Analyst

CAW Groep (Centres for General Welfare), 2023 to 2025

I supervised the production of outcome-orientated indicators (RGIs) for the Department of Care, improving project planning and communication and optimising stakeholder alignment. Through skilful project management, I significantly reduced the risk of inconsistent data processing.

Scientific Associate, ICT Data Team

Ziekenhuis Oost-Limburg (East Limburg Hospital), 2020 to 2022

Data analyst and document writer on internal and European healthcare projects. Analysed and modelled datasets using Power BI, DAX, and SQL. Ensured the continuation of external project funding by correcting the reporting of research outcomes.

Technical Writer

Dynacommerce, 2016 to 2017

Authored sales orchestration software for telecoms and utility companies. Collaborated with analysts, testers, and UX designers to produce copy and technical documentation for solutions, development, and sales teams.

Content Editor & Analyst

Selfservice Company,
2013 to 2015​

Identified gaps between customer expectations and service delivery. Analysed feedback loops to determine user sentiment. Reported on the effectiveness of interactions and recommended improvements.

HR IS Coordinator

VWR International Europe, 2013

Supported a user base of 3,400+ across Europe, ensuring platform reliability and high service levels. Analysing HR data, monitoring processes, and correcting errors. Produced user documentation and developed training courses.

From data into impact

Project Portfolio

A selection of projects in which I have transformed complex datasets into strategic tools — from in-depth scientific data analysis to streamlining KPI reporting in the social sector.

Data analysis
Power BI, DAX, M-code, MS Excel.
Development
Power Platform, Python, Azure Fundamentals.
Methodology
Knowledge management, stakeholder mapping, functional analysis, and technical writing.

I completed these projects on a part-time basis (20 hours per week). Managing my schedule this way allows me to maintain a healthy work-life balance, prevent burnout, and consistently deliver high-quality results.

CAW logo
Social sector

Outcome-Based Indicators for the Department of Care

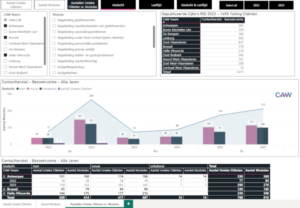
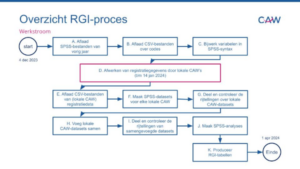
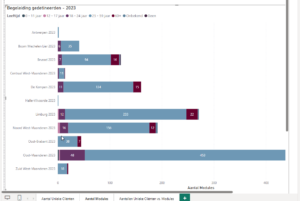
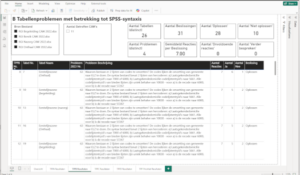
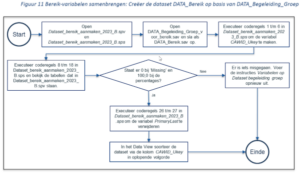
As a data analyst at CAW Groep, I supervised the production of Outcome-Based Indicators (OBIs) — KPIs covering the provision of welfare services across Flanders. I improved project planning and communication and optimised stakeholder alignment. Through skilful process and project management, I significantly reduced the risk of inconsistent data processing and improved the transparency of analyses. I also ensured that the KPIs were submitted on time for the first time in several years.


logo Myneva
Logo Department Zorg
Business process analysis
Project management
Technical documentation
Stakeholder management RACI
Process visualisation and optimisation
Feedback and consensus building
Impact reporting
Task configuration
Power BI iconPower BI
IBM SPSS Statistics iconIBM SPSS
DAX iconDAX Data Analysis Expressions
SharePoint iconSharePoint
Excel iconExcel
Icon MS OfficeWord / PowerPoint / Teams
logo Ziekenhuis Oost-Limburg
Healthcare sector

Standardised Health Outcome Modelling with Microsoft Power BI

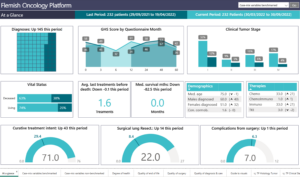
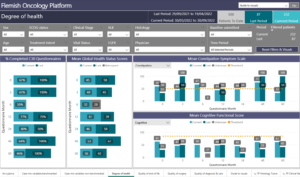
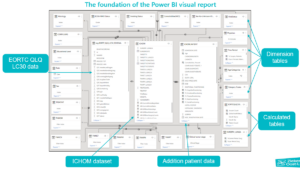
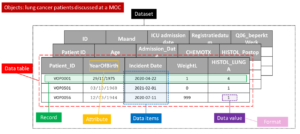
The Flemish Oncology Platform (FOP) was a cross-hospital collaboration designed to enable lung cancer specialists to compare treatments and patient outcomes. We worked with the standards of the International Consortium for Health Outcomes Measurement (ICHOM), which provides patient-centred outcome measures. In addition, oncologists identified supplementary variables essential to clinical practice that go beyond the standard ICHOM set.


ICHOM logo
AZ Delta logo
Logo UHasselt
Clinical Decision Support automation
Task configuration
Semantic modeling
Algorithm implementation
Agile development – Scrum
Project management
Technical documentation
Stakeholder management
Power BI iconPower BI
DAX iconDAX Data Analysis Expressions
SQL Server iconSQL Server Studio
Excel iconExcel
Icon MS OfficeWord / PowerPoint / Teams
Power Query logoPower Query / M-code
logo Ziekenhuis Oost-Limburg
Healthcare sector

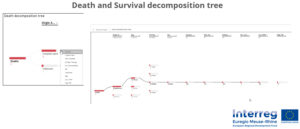
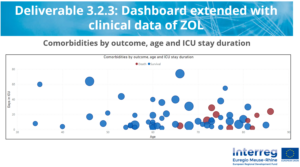
Cross-border insights from ICU data during the COVID-19 pandemic

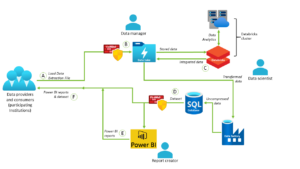
The Corona Data-driven Interventions & Data Platform (CoDaP) project was a large-scale study into the heterogeneity of COVID-19 patients in intensive care units. By consolidating available data and variations in clinical practice from Belgium, the Netherlands, Germany, and Switzerland, the CoDaP project aimed to generate new, cross-border insights.


Interreg Euregio Meuse-Rhine logo.
Logo Maastricht UMC+
Logo Jessa Ziekenhuis
Logo Uniklinik RWTH Aachen
Logo Groupe SantƩ CHC
Logo RapidMiner
Clinical Decision Support automation
Project management
Research reporting & technical documentation
Stakeholder management
Task configuration
Power BI iconPower BI
DAX iconDAX Data Analysis Expressions
Excel iconExcel
Icon MS OfficeWord / PowerPoint / Teams

Joycelyn is a real asset to our digitalisation team. She is friendly and helpful, actively thinks along with the team, works efficiently, and spontaneously offers solutions. She is eager to learn, always looking to improve, and communicates in a timely and clear manner.

Annelies Vanherck @ Erfgoedcel K.ERF,
Mdw. publiekswerking & cult. erfgoedzorg

Congratulations on the outstanding work you delivered for the FOP project. Without you, none of the below would have been possible!

Noƫlla Pierlet @ Ziekenhuis Oost-Limburg,
Chief Information Officer

Joyce is specifically skilled in analysing and documenting process flows. She accurately combines information of different sources to translate in user-friendly workflows and user manuals. She proved to apply a very structured approach in her project work.

Liesbeth Deserrano @ VWR Intl. Europe,
Project Coordinator HR Europe

Every collaboration starts with a good conversation

Get in touch

Whether you have a concrete project, a question about data quality, or want to know what is possible, I am here to help.
I work with organisations in healthcare, the social sector, government, and the business world, and am available for freelance assignments of up to 20 hours per week. Hybrid working in central Brussels, Antwerp, or the province of Limburg is possible, as is fully remote collaboration.
Fill out the form, and I will contact you within 2 working days.

Enter your full name.
This field is required.
Enter your telephone number.
This field is required.
Communication preference
Enter your message here and any additional information you wish to provide.
This field is required.

Scroll to Top