
Healthcare Sector
Cross-border insights from ICU data during the COVID-19 pandemic
The Corona Data-driven Interventions & Data Platform (CoDaP) project was a large-scale study into the heterogeneity of COVID-19 patients in intensive care units. By consolidating available data and variations in clinical practice from Belgium, the Netherlands, Germany, and Switzerland, the CoDaP project aimed to generate new, cross-border insights. The work was carried out in close cooperation with the Managing Authority and the Joint Secretariat of the European Union Interreg Meuse Rhine Programme (EU Interreg EMR), which monitored and guided the programme.
As a Wetenschappelijke Medewerker (Scientific Associate) at Ziekenhuis Oost Limburg (ZOL – East Limburg Hospital), my contributions to this project formed a primary deliverable for Interreg EMR and strengthened the continuity of research funding. My tasks included data curation, developing clinical dashboards, and reporting on data quality assurance protocols and technical frameworks for secure data exchange.
Methods
Contents







Deliverables
Interactive visual reports
Successfully mapped and integrated 86 cancer performance indicators (KPIs) spanning 8 clinical themes, including diagnostics, surgical quality, and end-of-life care.
Strategic data integration
Developed Proof-of-Concept Power BI COVID-19 dashboards as the primary project deliverables for the EU Interreg EMR programme. Engineered an analytical data model to seamlessly integrate disparate demographic and clinical patient data originating from ZOL and MUMC+, empowering clinicians to map ICU patient heterogeneity accurately.
Data quality assurance
Evaluated all operational data artefacts against the standardised DAMA NL data quality dimensions. Systematically removed structural anomalies and errors, guaranteeing that downstream Power BI visuals render precise, mathematically accurate views without requiring manual patches or overrides.
Standardised document control protocols
Established a rigorous document control infrastructure to formalise version history, track ownership, and log administrative metadata. Secured strict operational data governance and file traceability across all future project reporting cycles.
Comprehensive research & technical documentation
Authored exhaustive technical documentation outlining secure cross-border data exchange protocols. Produced operational reference guides covering data dictionary standards, data quality assurance frameworks, and visual report usage.
Tools




Publicity
Programme delivery for cross-border research
A critical milestone for the EU Interreg Euregio Meuse-Rhine (EMR) programme was the development of a visual reporting platform. This tool was designed to empower participating healthcare institutions to study the heterogeneity of intensive care unit (ICU) patient populations, while remaining scalable for rapid adoption by external hospitals.
The contractually agreed project programme mandated a strict, phased delivery schedule for the proof-of-concept (POC) dashboards:
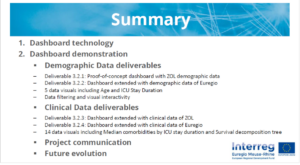
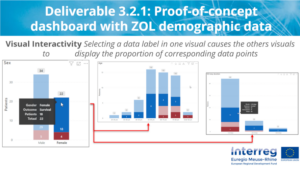
- Deliverable 3.2.1: POC dashboard utilising ZOL demographic data.
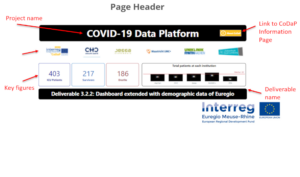
- Deliverable 3.2.2: POC dashboard extended to incorporate Euregio demographic datasets.
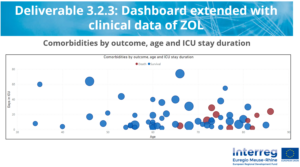
- Deliverable 3.2.3: POC dashboard integrated with ZOL clinical data.
- Deliverable 3.2.4: POC dashboard extended to encompass Euregio clinical datasets.
To meet these strict compliance requirements on schedule, I engineered the Power BI data models with a highly scalable, modular architecture that enabled phased deployment.
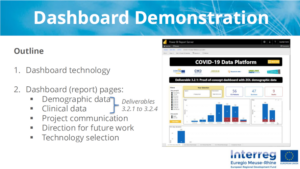
I engineered the baseline demographic interface using ZOL datasets to fulfil deliverable 3.2.1. Rather than rebuilding the dashboard for the next phase, I refactored the underlying data architecture to ingest and harmonise data from other institutions. To achieve deliverable 3.2.2, I integrated two comparative cross-filtering visual elements: one displaying real-time patient volume distributions across all participating facilities, and another enabling interactive, institution-specific data slicing.
I deployed the same scalable strategy for the clinical phases. I mapped out the core clinical reporting interface utilising ZOL patient data (3.2.3), and subsequently scaled the data pipeline to ingest broader Euregio datasets (3.2.4). This final expansion was supported by two additional visual matrices that dynamically mapped cross-institutional clinical variables.
Disparity & restrictions
Interoperability barriers
Challenge: Cross-institutional data integration was impacted by system disparity and legislative constraints.
Each participating hospital used a distinct Electronic Health Record (EHR) system, creating structural data conflicts that complicated dataset consolidation.
Strict data privacy regulations made it legally impossible to publish reports containing aggregated, identifiable patient data from multiple independent healthcare institutions.
Solution: To bypass these operational bottlenecks, a secure, scalable data governance solution was implemented.
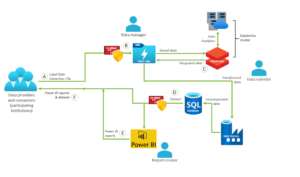
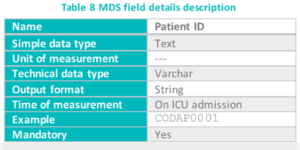
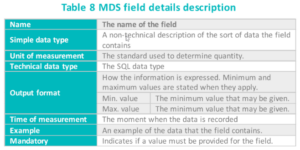
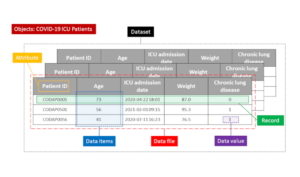
I authored a comprehensive data dictionary. It was based on a customised, fully anonymised data export from ZOL’s EHR, specifically the CoDaP dataset. This dictionary precisely defined the clinical meaning, data formats, and technical attributes of every variable, and standardised data mapping.
By establishing this clear data blueprint, I enabled data teams to seamlessly align, append, and integrate matching anonymised patient datasets originating from Maastricht UMC+ (MUMC+), safely expanding the project’s analytical reach.
Safeguarding Integrity
Framework-driven DQA audits
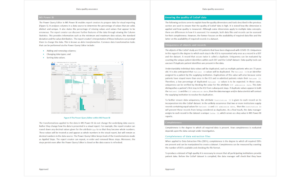
Challenge: A core project deliverable was the development of interactive visual reports that present clinical data from multiple healthcare institutions in a clear, comparable format.
However, blending disparate data streams from independent hospital Electronic Health Record (EHR) systems introduced operational risks, including data corruption, record duplication, and structural inconsistencies that threatened the validity of downstream analytics.
Solution: To mitigate these risks and secure absolute data integrity, I engineered a rigorous Data Quality Assurance (DQA) protocol.
I validated data artefacts against the data management standards defined by the Data Management Association (DAMA). From the 60 available quality dimensions, I isolated and applied the specific subsets most critical to each data layer. For example, I applied the ‘completeness’ metric across both clinical attributes and system records. At the attribute level, this guaranteed that critical operational fields, such as ‘Admission Date’, were fully populated and standardised.
As a direct result, all downstream Power BI visuals rendered completely accurate data views seamlessly, eliminating the need for manual text patches or fragile code overrides.
Front-End UX – Accelerating data literacy and onboarding
To motivate daily clinical adoption and simplify data interpretation for frontline healthcare professionals, I deployed strict, user-centric front-end design standards across the CoDaP dashboard suite, treating cognitive accessibility as a core technical requirement.
- Standardised Visual Hierarchy: Positioned high-impact Card visuals at the apex of every interface to display critical operational totals prominently (e.g., total ICU volume per facility and survival rates), reinforced by clear partner branding to solidify institutional trust.
- Synchronised slicing & interface uniformity: Standardised the global layout geometry and page headers across all patient-facing data views. I deployed synchronised slicer matrices to allow intuitive, cross-page filtering by institution, age cohort, and clinical outcome, introducing specialised local variables (such as ‘Sex’) only where technically necessary.
- Clinical chart optimisation: While standardising column and bar charts to align with existing clinical preferences, I integrated advanced spatial and relational visualisations for deeper exploratory analysis:
- Scatter plots: Applied to map and correlate patient comorbidities directly against outcome, age, and total ICU duration.
- Treemaps: Implemented to provide a high-density, volumetric representation of active comorbid conditions (e.g., diabetes, chronic renal disease, and deep vein thrombosis).
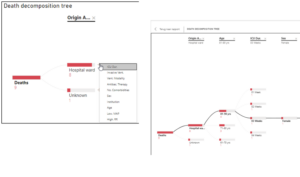
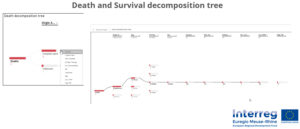
- Decomposition trees: Leveraged to empower clinicians to dissect and explain patient mortality risks dynamically across up to eight distinct dimensions simultaneously (including admission origin, ventilation type, and length of stay).
Star schema engineering & relational mapping
A mandate of the CoDaP initiative was to engineer an integrated, cross-institutional data infrastructure. The system required a robust data model capable of merging disparate datasets from multiple healthcare facilities into a singular, standardised reporting platform to help clinical leadership identify and compare outbreaks.
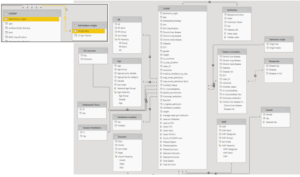
- Centralised fact table: Implemented a formal star schema architecture, utilising the comprehensive, multi-institutional CoDaP dataset as the primary central fact table.
- Dimensional lookup tables: Engineered and mapped supplementary dimensional lookup tables, including contextual parameters such as ‘Admission Origin’, to support complex cross-filtering and eliminate data anomalies across disparate hospital sources.
- High-density reporting architecture: Structured the ingested data across a 3-page report: a 5-visual demographic page, a 14-visual clinical data page to track acute variables (e.g., antibacterial therapies and ventilation modalities), and a page describing the CoDaP project.
To establish a stable foundation for multi-site analytics, I architected a modular relational framework within Power BI:
Work Samples
Research reporting
As a research project co-funded by the European Union’s Interreg EMR, CoDaP carried specific reporting requirements to demonstrate the achievement of its objectives. This included detailed technical and methodological documentation covering data exchange mechanisms and quality assurance. All of which I was responsible for authoring.
To ensure consistency across every document, I developed a Word documentation template which included the following as standard:
Styling
Ziekenhuis Oost-Limburg house style; Partner’s logos
Properties
Title; Author; Manager; Company; Subject
Metadata
Last update date; Owner(s); Author; Approval status; Version number
Sections
Table of contents; List of figures; List of tables;
About this document; Introduction; Glossary
In total, I produced nine documents covering the operation and content of the visual report, intended for IT professionals, healthcare providers, and programme monitors:
Data quality assurance
Sharing data using Microsoft Azure
Data dictionary
COMAC presentation slide deck
LiquidFiles for data exchange
POC dashboard with ZOL demographic data
POC dashboard extended with demographic Euregio data
POC dashboard extended with clinical data of ZOL
POC dashboard extended with clinical data of Euregio