
Outcome Orientated Indicators
Annual reporting to the Belgian Department of Healthcare
In Belgium, CAW stands for Centre for General Welfare (Algemeen Welzijnswerk) — a major first-line assistance organisation providing professional support, counselling, and temporary shelter to anyone facing emotional, social, relational, or material challenges. Eleven autonomous, non-profit regional CAW centres operate across Flanders and Brussels. The CAW Groep is the overarching sectoral organisation that connects all centres and handles shared projects, such as the sectoral client-tracking system and annual reporting to the Flemish government.
As a data analyst at CAW Groep, I led the production of Outcome Orientated Indicators (KPIs) for the provision of social welfare services across Flanders. In the years preceding my involvement, submitted figures had been called into question for their reliability and validity—and the reasons were disputed. My role involved bringing clarity to that situation: improving project planning and communication, resolving methodological disagreements, and aligning stakeholders.
Methods
Contents



Deliverables
Workflow mapping & documentation
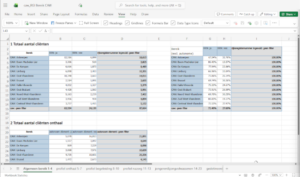
Parts of the process were known only to a handful of stakeholders, and there was active disagreement over which methods should be used. There was very little documentation describing how indicators were calculated, and what existed was outdated. I made these processes, methods and calculations explicit — uncovering the knowledge required to produce accurate figures promptly and creating a foundation that future teams could build on.
Tactical Improvements within operational limits
There was a firm requirement to achieve gains in accuracy and efficiency without modifying the existing SPSS-based methods used to obtain analytical results. I identified areas in the production process that could be restructured or simplified, and applied targeted solutions to each.
Uniform data processing
By introducing checkpoints at key junctions in the process, I was able to surface analytical disagreements before they could affect the final figures. This significantly reduced the risk of inconsistent data processing and ensured that no variables were reported as missing in merged datasets.
On-Time regulatory compliance
Historically, CAW struggled with compliance, submitting indicators late to Departement Zorg (a government service of the Flemish government responsible for health, welfare and family policy) for two consecutive years and requiring multiple post-submission corrections. Using my project and stakeholder management skills, I ensured that the 2024 indicators were submitted three days ahead of the deadline.
Pragmatic corrective action plan
Through consultation, interviews, and stakeholder polling, I conducted a post-project evaluation to assess the extent to which reporting objectives had been achieved and identified both the failures and the successes of the reporting cycle. I facilitated a collaborative process in which data workers across the CAW network determined 10 concrete actions to take in preparation for the following year and produced a plan that honestly acknowledged real gaps in skills and resources.
Tools


Context & Work Samples
Removing bottlenecks & reducing reporting overhead
It had been agreed across all CAW organisations that each would export data from the client tracking system on 15 January every year and upload all CSV files to a shared repository housed on SharePoint.
This placed significant strain on the system – 11 users downloading and uploading 31 files concurrently. Furthermore, it regularly resulted in files being misplaced or exports being performed on the wrong date. The latter presented a unique challenge: because there was no indexing, matching records relied entirely on the export date. If files carried different export dates, connections between records could not be made, and relevant data went uncounted.
Rather than having each CAW organisation perform its own exports, I centralised this task so that it is carried out by the other 2 members of the data team at CAW Group and me. We also uploaded exports to SharePoint and retained copies of all files for a short period. This meant that the original version could be retrieved if a file became corrupted or was lost.
Further improvements I recommended include:
- Reducing the number of CSV files required from Myneva.
- Significantly reduce the risk of human error by automating data exports and processing.
- Removing the dependency on matching run dates by introducing indexing.
Alignment & standardisation
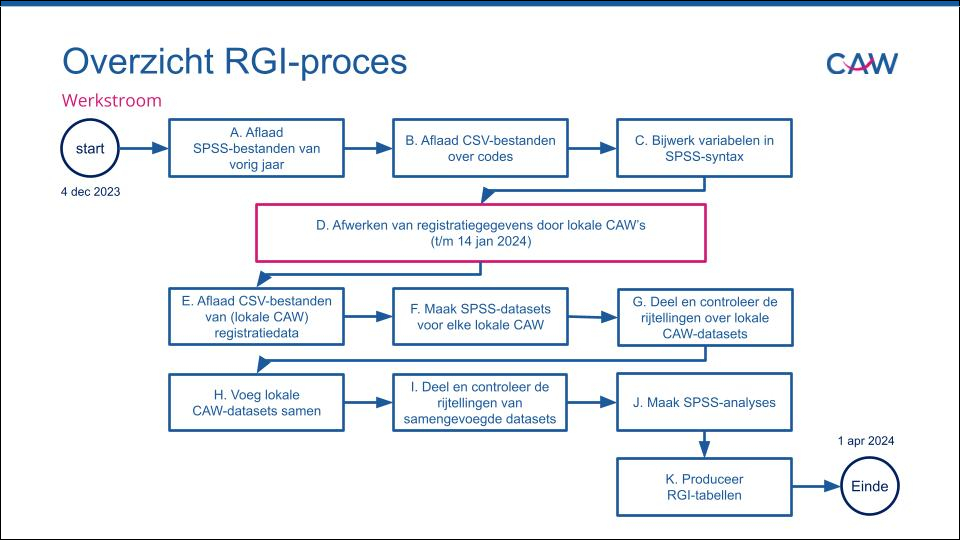
Analytical process mapping
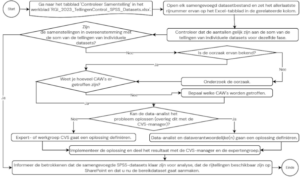
The Challenge: Due to staff turnover and complex management structures, the indicator production had become internally opaque. Existing documentation had not been updated to reflect modifications to reporting requirements. My task was to shift CAW from a subjective, intuitive understanding of how indicators are produced to a clear, objective blueprint.
The solution: By consulting key stakeholders, I mapped the end-to-end indicator production process, identifying the triggers, actors, and rules governing each task. By auditing critical time metrics (including touch time and cycle time), I uncovered specific operational bottlenecks, redundancies, and manual inefficiencies. I resolved these issues by designing a structured project roadmap for the upcoming year, reinforced by updatable business and technical documentation to streamline future reporting cycles.
Streamlining workflows
Accelerating data processing
The Challenge: At CAW Groep, it was not possible to download a single report containing data for all 11 regions. Each region had to be selected individually in the client tracking system, with reports downloaded separately and then merged. Combining 11 CSV files into one is possible in both SPSS and Power Query — but in practice, this task was extremely time-consuming, particularly when multiple types of CSV files were required for a single data query.
The solution: I looked for a faster approach that would not incur additional IT costs. In my solution, I used Windows PowerShell. I adapted existing code to complete the task in three steps: 1) rename files, 2) add an identifying variable, and 3) append the files to create a single file. Before leaving CAW Groep, I documented the solution clearly and walked my colleagues through it, ensuring continuity after my departure.
Uncovering reporting bloat
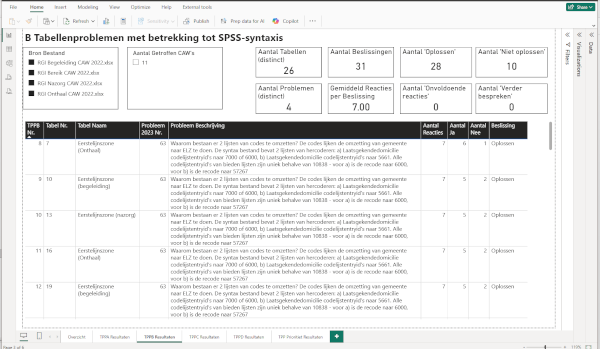
A ministerial decree explains which indicators CAW-Groep must provide. An initial analysis of the indicator content descriptions suggested that only 142 tables needed to be produced. In practice, however, there are 214 named outcome orientated indicators evidenced by 366 tables across four MS Excel workbooks submitted annually to the Department of Care.
This discrepancy has several likely causes. Some additional tables may reflect indicators that individual CAW organisations have historically defined under Article 3. The remainder may arise from multiple table versions: for the vast majority of indicators, results are calculated both including and excluding autonomous elements and both where the national register number is known and unknown. For most tables, an additional version is then manually created in MS Excel to display results as percentages – a process that is highly time-consuming and carries a significant risk of human error.
Rather than having each CAW organisation perform its own exports, I centralised this task so that it is carried out by the other 2 members of the data team at CAW Group and me. We also uploaded exports to SharePoint and retained copies of all files for a short period. This meant that the original version could be retrieved if a file became corrupted or was lost.
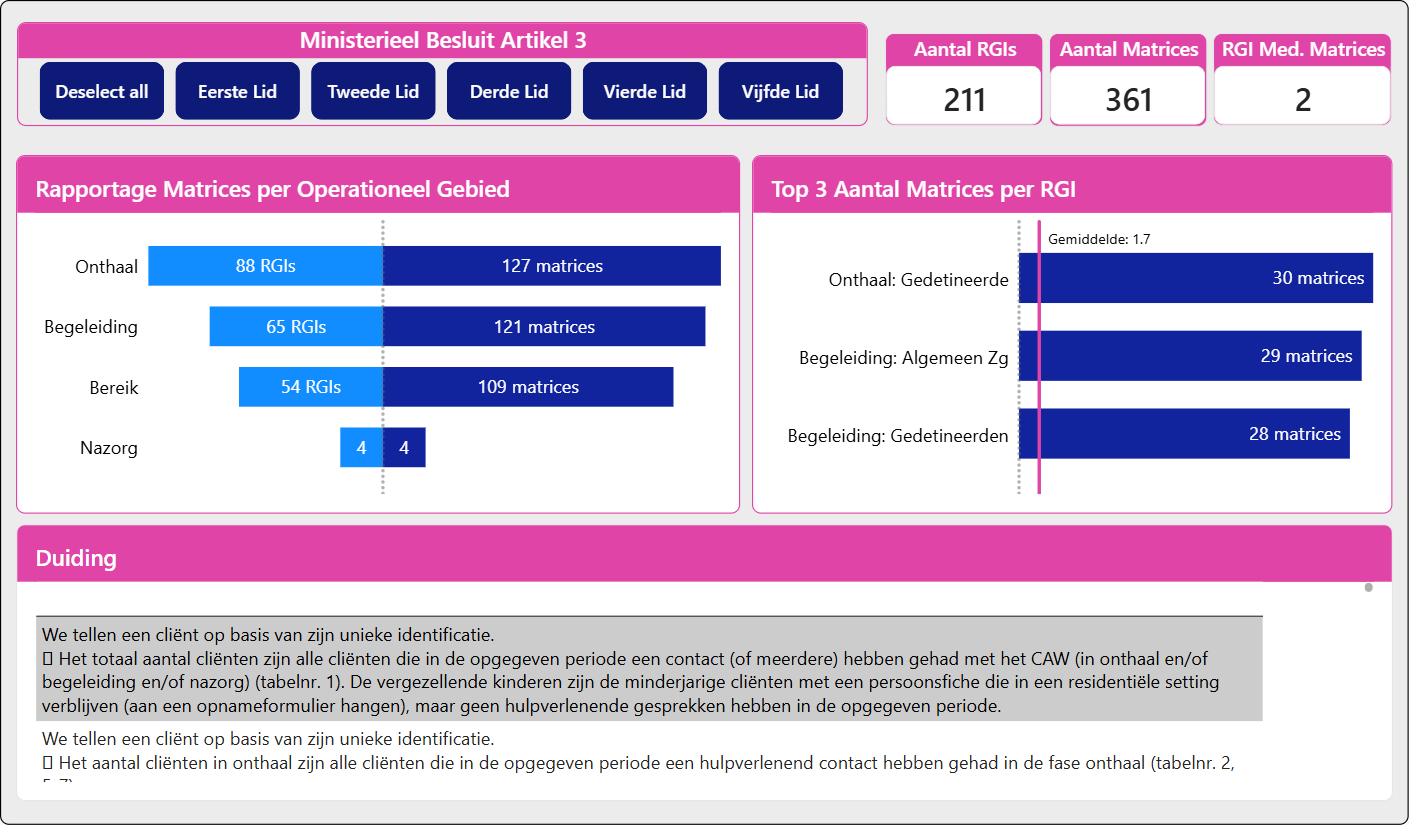
To mitigate these issues in the future, I suggested to CAW organisations that they should consider reducing the number of tables, in consultation with the Department of Care.
Post-project evaluation
After the indicators were submitted to the Department of Care, I led a post-project evaluation that integrated the perspectives of all project participants.
1. Identify failures and successes
I collected project data — including emails, MS Teams conversations, meeting minutes, and SPSS files — and analysed it to identify when and where project disharmony had occurred. Where data from the previous year was available, I compared it to uncover improvements and measure team effectiveness..
2. Assess the extent to which the objectives were achieved
I produced an evaluation report describing the methods used to produce indicators and the key findings regarding working practice. This report was shared internally across the CAW network.
3. Translate insights into actions
The report included concrete recommendations for improving outcomes in future cycles. In the meetings that followed its dissemination, I guided data workers from across the CAW organisations in deciding which recommendations would be implemented, by whom, and by when.