
Vlaams Oncology Platform
Standardised health outcome modelling with Microsoft Power BI
The Vlaams (Flemish) Oncology Platform (VOP) was a pioneering cross-hospital collaborative initiative that enabled lung cancer specialists to compare treatments and patient outcomes. The project united Ziekenhuis Oost-Limburg (ZOL) with AZ Delta, the University of Hasselt (UHasselt), and the International Consortium for Health Outcomes Measurement (ICHOM).
As the lead analyst and project manager, I directed project planning, progress reporting, and cross-hospital alignment. I translated complex clinical requirements into actionable data tasks while ensuring strict GDPR compliance. On the technical side, I served as the lead Power BI developer, architecting a highly portable data model to bridge standardised global metrics with localised clinical needs.
Methods
Contents





Deliverables
Standardised clinical framework
Successfully mapped and integrated 86 cancer performance indicators (KPIs) spanning 8 clinical themes, including diagnostics, surgical quality, and end-of-life care.
Strategic data integration
Blended the 144-variable ICHOM lung cancer standard dataset with localised hospital electronic health records (HiX) and longitudinal EORTC QLQ-C30 patient survey data.
Scalable data architecture
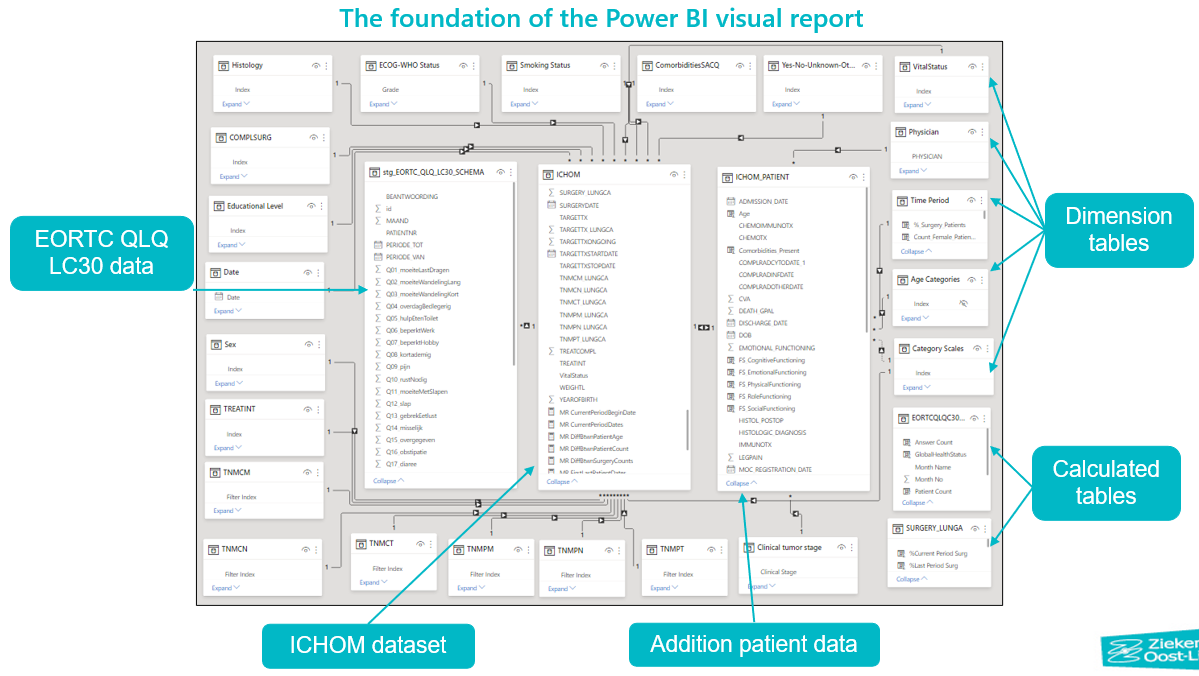
Engineered a high-performance Snowflake data model in Power BI utilising multiple fact tables, custom dimension tables, and extensive DAX calculations.
Advanced visual analytics
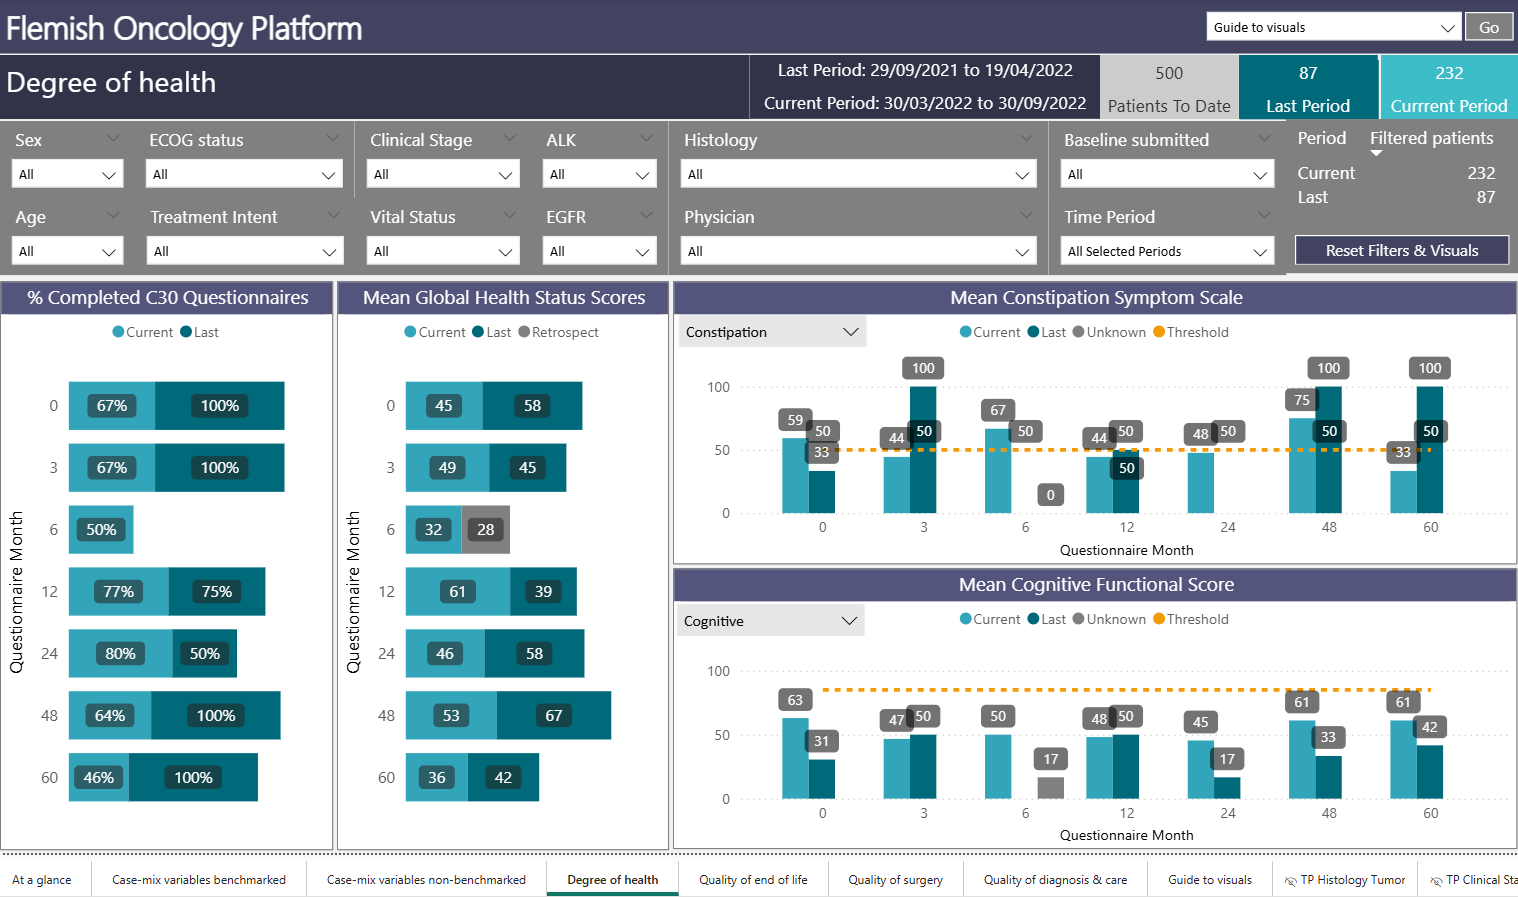
Designed a comprehensive 10-page dashboard with 4 contextual drill-through pages, mapping complex patient pathways and tracking quality-of-life metrics over time.
Report portability
A core non-functional requirement was “report portability”—allowing any external hospital to adopt this dashboard without heavy infrastructure overhead.
Comprehensive stakeholder handoff
Delivered a final package including the approved Power BI report, an extensive ICHOM data dictionary outlining the new variables, rich in-report commentary, and tailored PowerPoint presentations for diverse medical and administrative audiences.
Tools




Publicity
Accessible design – UX
To drive clinical adoption and seamless user onboarding, I implemented rigorous front-end design standards:
- Tailored UI: Styled the interface using an accessible, WCAG-compliant colour palette derived from the hospital’s corporate identity.
- Clinical Slicers: Embedded intuitive, oncologist-requested filters for immediate segmentation by age, vital status, and tumour histology.
- In-App Enablement: Developed interactive tooltips providing explicit contextual guidance on hover for every chart, backed by a dedicated, comprehensive internal documentation page explaining what each KPI measures.
DAX vs. ETL
Architecting for report portability
The Challenge: Best practice dictates transforming data as far upstream as possible. However, external hospitals may lack data engineering, SQL or advanced M-code skills, creating a barrier to adoption.
The solution: I shifted data transformations downstream using client-side DAX calculations. By encapsulating the business logic entirely within Power BI, external hospitals could implement the report immediately without needing to re-engineer their servers or modify complex Power Query steps.
Duplicate variables
Resolving schema anomalies
The Challenge: During early prototyping, I discovered duplicate variable names originating from different contexts within the official global ICHOM standard dataset, which risked breaking model relationships.
The solution: I resolved these structural bugs by implementing a contextual numbering convention. For example, the two variables named ‘complication’ were renamed to ‘complication_1’ and ‘complication_2’. I also reported these findings back to ICHOM, which formally acknowledged the bugs for future releases.
Ensuring data quality
Blending clinical research data with hospital EHR systems introduces a significant risk of data corruption and duplicates.
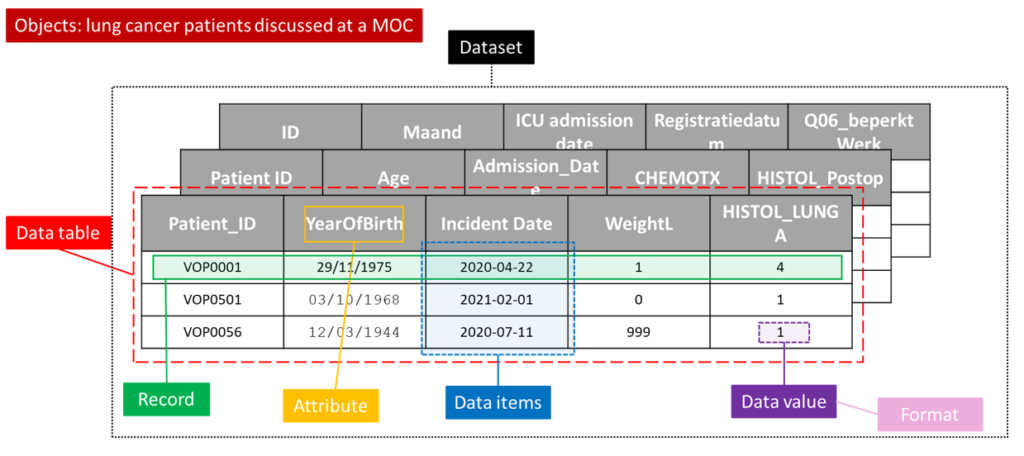
I evaluated and ensured the quality of all data artefacts using the standardised data management quality dimensions defined by the Data Management Association (DAMA).
From the 60 available dimensions, I isolated and applied the specific subsets relevant to each artefact. For instance, I applied ‘completeness’ strictly to attributes and records. The former ensured that critical fields like ‘WeightL’ were populated. The latter ensured uniqueness by catching errors such as 3 separate ICHOM records for a single patient.
Overcoming longitudinal tracking gaps
The standard ICHOM dataset only records Patient-Reported Outcome Measures (PROMs) at the baseline “time of intake”. Relying strictly on this schema made it impossible for oncologists to monitor patient recovery or symptom degradation over time.
I integrated a separate, live dataset tracking all historical EORTC QLQ-C30 questionnaires administered throughout the treatment life cycle.
To allow clinicians to dynamically isolate patient trends across distinct intervals, I implemented custom time-intelligence slicers:
- During the last 6 months
- From 6 to 12 months ago
- Over 1 year ago
Post-project optimisation
After the official project deployment, I retained an anonymised, patient-free copy of the report framework to test and apply advanced, modern Power BI architecture techniques using a synthesised dummy dataset. I successfully refactored the entire project to meet higher-level engineering standards:
Upstream ETL refactoring
Shifted data transformations completely from client-side DAX into Power Query M, generating optimised dimension tables and calculated columns at the ingestion layer.
Model optimisation
Removed legacy DAX calculated tables and columns, stripped out unused variables, and purged hidden foreign keys to minimise file size and improve processing speed dramatically.
Metadata & governance
Added explicit descriptions to all tables and columns, utilised Power Query parameters for dynamic data sources and date ranges, and aggregated all calculations into a dedicated measures table organised cleanly into subject-matter folders.